Over the course of an average day, our life is touched by literally thousands of regulations. They are at work from utility services, telecom services, oil and petrol, to public transport,banking, housing and other government services. Ever wondered why these regulations exist at the first place??? What is the economics behind these Regulations?
What is free in free market??
Economics explains lot of real life scenarios such as public welfare and regulations which are entwined with complex set of cause and effect phenomenas. Few such interesting concepts which explains why regulations are in existence are 'Free Market Failures and Externalities'. You will appreciate their true meaning and contribution in explaining the esoteric workings of an economic system when you see them at work in real life.
These seemingly arcane terms, work on the fundamental premises of ecomomics i.e. forces of demand/supply and efficient allocation of resources. A free market is a market where there is no intervention of a controlling authority (Government) and market is left to the forces of demand and supply. The prices of the services or products exchanged in such markets are agreed solely by mutual consent of buyers and sellers in the market. In such a market the allocation of products i.e. who gets what, is decided by purely the purchasing power of consumers and forces of supply/demand. Adam Smith, one of the influential economist of 19th century, coined the term 'invisible hand' to describe the self regulating structure of market due to invisible forces of
- Self interest i.e. doing what maximizes my profit or doing what is good for 'me';
- competition between the market participants and;
- demand and supply
Now, free market premise is based on ideal conditions in the market such as markets are perfectly competitive and no market power exists with any player eg. Monopoly, market participants are perfectly informed about choices and interchangeability exists between goods and services. The necessary components for the functioning of an idealized free market include the complete absence of artificial price pressures from any form of government intervention(other than protection from coercion and theft, and no government-granted monopolies which eventually makes it "pareto efficient'(Named after italian economist). So we see the cause and effect chain as:
Free Market - causes - Competitive forces, prices decided by market forces with no government intervention (idealized conditions)- leads to - efficient allocation of resources- leads to - Pareto Efficient market
Why Markets Fail?
In reality, we dont see a idealized scenario of a free market at work. What we see is a deviation from the equillibrium where there are lot of other factors influencing the market forces and competition which leads to an inefficient allocation of goods and services to producers and consumers. Economists have identified following scenarios when a market can fail(i.e. where individual self intretest leads to inefficient the resource allocation). Now this is the exact reason why government steps in to ensure that allocation happenes in a way that ensures equitable distribution of benefits to all participants and therefore economic and social welfare can be maximized. Market Failure eventually lead to inefficient and hence said to be 'Pareto inefficient'. Economists have defined following causes of market failures:
- Externalities: When consumers and producers come together in the market, the products/services are exchanged in return for money or the price of the goods/services. However, there could be costs/benefits associated with this transaction which is not transmitted through prices but through any other means and borne by the thrid parties not involved in this transaction.A live Eg. is Posco, steel maker,is alleged to have violated the forest act while acquiring land for a steel project near Paradip and where as Vedanta, mining company, is battling criticism from environmental groups over plans to extract bauxite in Niyamgiri hills in the state's Kalahandi district. Both firms are engaged in capacity enhancement activities which is linked to profit maximization. however, these actions have negative externalities in terms of social cost(effect on tribes and wild life in orissa) being greater then the private cost of the firms.
- Monopolies or market dominance: these occur due to imperfect competition in the market. It can happen due to various reasons. A firm gains a monopoly over market resource, Government gives exclusive right to one firm to produce or provide services or cost of production (gained from economies or scale or strategic investments)makes a single produce more efficient then others in the market.An example is BSNL as it was given exclusive rights to sell telecom service to users and entry barriers were high till the time the market was opened to private players.
- Information Asymmetry: This happenes when both buyers and sellers will have different information about the product’s attribute or one party has more or better information about the product than the other.A classic example is Financial services and Financial intermediaries.Imagine for a moment that Banks do not exist and people have no other options to search for the right lender who can lend the fund to them. Similerly lenders search for the right investors. That would be a difficult scenario. So the primary reason why people give/deposite their money to Banks/financial intermidiaries instead of lending or investing the money directly is because of the risk that is present from the information asymmetry between the provider of funds and the receiver of those funds.A seller knows more about the sale item than the buyer.Likewise, a borrower knows more about his financial condition and his future prospects than the lender.
How Government intervenes to correct Market Failure?
In a market failure scenario, an economic rationale behind government intervention is:
1) Ensuring equitable distribution of economic benefits/income/wealth to the participants as a whole.
2) Correcting the losses suffered by market failure thereby making market efficient.
A government achieves this by several means such as taxes, subsidies, bailouts, public policies etc. One of the means is Regulations also called Command and Control technique.However, government regulation does not necessarily ensure equity and efficiency and may result in what is called Regulatoy Failure which could be a negative externality of regulations.
Market Inefficiency- causes -Market Failures - Government intervenes by means of Regulations, subsidies, taxes etc - which may (or may not) lead to - efficient allocation of resources and equitable distribution of income and wealth- leads to - Pareto Efficient market
Thursday, August 26, 2010
Thursday, August 19, 2010
Targeting Below The 'Line'...
Food is one of the basic necessities of human being without which all other amenities would hold little meaning. And to a poor, it could mean the vary existence of his life. In a rapidly growing indian economy and a nation of more than one billion people with per capita income crossing 40,000, more than half of the population live below the elusive poverty line (BPL). Well that sounds alarmingly menacing isn't it? In such a scenario food security becomes one of the major developemental objectives for government.
How does one measure poverty in India?
If we go by the definition set by Planning Commission of India, poverty line is drawn with an intake of 2400 calories in rural areas and 2100 calories in urban areas. That means, if a person is unable to get that much of calories he is considered to be BPL. However, many descrepanies have been observed in the measuring methodologies adopted by various agencies and no body has been able to nail down the exact number. The meauring methods and parameters differ from countries to countries. This vary reason has led to disparities in defining the real distribution of poor population in states of India.
How does food get to the poor?
A poor man in India has two options.Either food should be made available to him at an affordable prices by the government or Government should find ways and means to raise the income level of the poor so that they are capable enough to buy food for themselves. While employment generation programmes attempt the first solution, the PDS is the mechanism for the second option.In terms of both coverage and public expenditure the most important safety net is Public Distribution System (PDS) of central government. With a network of more than 4.62 lakh fair price shops (FPS) distributing commodities worth more than Rs 30,000 crore annually to about 160 million families, the PDS in India is perhaps the largest distribution network of its kind in the world. The FPS provide rice, wheat, sugar, edible oil, soft cake and kerosene oil at subsidized prices.With PDS, government achieves two objectives ensure food security for the needy and price stability of food.
Targeted Public Distribution System(TPDS)
The Public Distribution System in India was modified into the targeted public distribution system (TPDS) in 1997, as part of the larger reforms under the new economic policy of the 1990s. The TPDS divided the population of the country into those below the poverty line (BPL) and above the poverty line (APL); with PDS foodgrains being given to those in these two categories at differential prices. this price differential is acheived by giving greater subsidies to the poorest of poor compared to those BPL in normal sense. In 2002, another category was introduced to reach out to the ‘poorest of the poor’ through the Antyodaya Anna Yojana (AAY) which provides foodgrains at about half the BPL prices. In PDS-
· The central government, based on the population of the state and its share of below and above poverty line households, allocates state wise quota of food grains. It also decides the Central Issue Prices (CIP) for the food grains
· The state government then determines off-take, the public delivery, and the list of commodities provided. The state government is allow to add to the CIP the transactions cost of keeping the stock and district wise allocation of food grains.
· thenBlock/ Taluk wise allocation of food grains is determined by District Administration. Location of Fair price shops are also decided at this level.
· Food grains are stored in godowns at various levels
· And finally, distribution of Food grains to the Fair Price Shops and sold to beneficiary, the poor.
But is making food grains available by TPDS, a sufficient condition to ensure food security to the poor? Given central government's poor record of public welfare schemes implementation. has TPDS managed to achieve its slated objectives?
Lacuna in TPDS
1) The very first reason being the divergent views on measurement of the poverty and number of people below poverty line. The earlier 1993 Expert Group on Poverty Estimation even explicitly specified in its report that these poverty lines should not be used for the purpose of targeting public programmes. However, in practice the exercise of setting a poverty line and estimating poverty on the basis of this has very much been linked to determining allocations for public programmes;
2) The decision that a particular household will qualify as BPL household and would be eligible for a BPL ration card is arrived at by two different processes. Firstly, the numbers of BPL households are determined based on the Planning Commission estimates of poverty superimposed on the number of households from census data. Secondly, an independent exercise of identification is conducted based on a household census using criteria determined by the Ministry of Rural Development (MoRD), with the restriction that the number of poor to be identified by this process should be within the number estimated by the Planning Commission.
3)The next immediate fallout of the above two factors is problems of imperfect targeting. That is the system is likely to include people that should be excluded and exclude household that should be included.
4) The reports of the Supreme Court appointed Wadhwa Committee point out a number of issues that make the PDS a corrupt and inefficient system. Among the issues these reports raise include corruption because of the presence of middle-men at all stages such as private storage agents, transporters, millers and so on, who are in a nexus with the politicians and bureaucracy resulting in the leakage of foodgrains meant for the PDS into the open market even before it reaches the village fair price shop (FPS).
5) Wadhwa committe report also identified following deficiencies in the system:
· Multiple ration cards being issued under a single name
· Faulty system of issue of ration cards and record keeping
· Pilferage - PDS foodgrains find way to market and all the lot don’t reach the eligible/needy person
· No bio-matric identification for the users
· No central monitoring system to track the carriage trucks
· The delivery mechanism has no RFID (Radio Frequency Identification Device)
In addition to above glaring gaps, there are even instances where the wheat and rice provided were unfit even for cattle consumption !, but the poor are forced by these weevil ridden grains.
There have been recent reports of around 61,000 tonnes of foodgrain rotting in granaries of Food Corporation of India (FCI), the government body responsible for TPDS. Officials admit that for 65 million tonnes of food buffer stocks the total warehousing capacity in the country is only 40 MT, a deficit of 25 MT. Investment of 10,000-15,000 crore is required for additional storage capacity.
Can Technology be a solution?
Wadhwa committee suggested major revamping of the system by leveraging technologies such as RFID and biomatric finger prints. Also, with the commencement of UID project, the databases of beneficieries could be maintained enabling digital record keeping. Use of smart card based technologies and presence of Point of Sales solutions to the Fair price Shops could make the system more efficient and could pave way for the setting successful e-governance example.
Allocations for public programmes must be delinked from the poverty line, which in spite of any number of revisions cannot avoid an element of uncertanity. How can a system be efficient of the vary foundation it is built on (measure of poverty) has the element of arbitrariness, a moving target!! Given the fact that we have the highest malnutrition rates in the world, there cannot be an alternative to provision of universal services especially in relation to food along with education, health, employment and social security.The proposed National Food Security Act should be seen as an opportunity for pressing for universalisation of PDS (along with administrative reforms) to make the system more effective. We must not allow an Act to remain an entitlement for only a few (as is being proposed), especially because as long as PDS remains targeted even the few who are entitled to it are unlikely to get any benefits.
References:
http://www.indiacurrentaffairs.com/
JUSTICE WADHWA COMMITTEE Report on Public Distribution System (PDS)
Planning Commision Report on five year plan
Monday, August 16, 2010
Oil Economics - Indian Perspective
Oil has been one of the most significant and vital industrial resource to any economy. When first and second waves of industrialization (pre and post WW I and II) happened across US and Europe during the beginning of 19th century, Oil played a very crucial role in fuelling the growth of world economies. India rely on primarily crude oil (32%), coal(52%), natural gas(10%), hydro(5%) and nuclear energy (1%) sources for its energy needs. There is no denying to this fact that as India ushers into a new age of growing competitive markets, there would be ever increasing reliance on scarce resources. However, if we have to understand the extent of this dependence, we first have to familiarize ourselves with the structure and economics of India Oil industry structure.
Structure of Indian Oil Industry
Oil industry exists at two different levels. "Upstream” players are involved in the site exploration and production of the primary component that gives all varieties of petroleum products i.e. crude oil. The major state-owned players in the upstream sector are Oil and Natural Gas Corporation Ltd. (ONGC), and Oil India Ltd. (OIL); the major private sector players are Reliance, Cairn Energy, Hindustan Oil Exploration Company Ltd. (HOEC), and Premier Oil. Upstream players perform following activities:
->Exploration for hydrocarbons.
->Production of crude oil and natural gas.
->Transportation of crude oil to downstream players refineries
"Downstream" players are involved primarily in operations such as refining, pipeline transportation, fuel marketing and R&D. These companies directly interface with the retail customers. The players include Hidustan petroleum (HPCL), Bharat Pentroleum(BPCL), Mangalore refinery and petroleum limited(MPCL), reliance Industries, Essar oil etc. These companies maintain a retail distribution network across the nation deploying retail outlets, bulk consumer pumps, LPG distributorships and plants, aviation fuel stations etc.
India is a net importer of crude oil. What that means is, more than 50% of its petroleum needs are fulfilled by sourcing and import of crude and petroleum products. This import is fully controlled through the government-owned Indian Oil Corporation and controlled by the empowered standing committee of the Centre.
Petroleum prices in India are affected by three broad factors:
-> International price of crude oil and petroleum products in terms of dollars - as the downstream players import crude oil from international markets;
-> Rupee - dollar parity - rupee/doller fluctuations significatly impacting the prices;
-> Inflation within India
How are petroleum products priced?
In India there are four highly consumed (> 60%)petroleum products are petrol, diesel, kerosene and LPG. The country operates under an Administered Pricing Mechanism for petroleum products. Under the APM, product prices are directly administered by the GoI, based on an opaque and complex “cost of operating capital plus” formula.This system is based on the retention price concept under which the oil refineries, oil marketing companies and the pipelines are compensated for operating costs and are assured a return of 12% post-tax on networth. Under this concept, a fixed level of profitability for the oil companies is ensured subject to their achieving their specified capacity utilisation. Upstream companies, namely ONGC,oil and GAIL, were also under retention price concept and were assured a fixed return.
The administered pricing policy of petroleum products ensures that products used by the vulnerable sections of the society, like kerosene, or products used as feedstocks for production of fertilizer, like naphtha, may be sold at subsidized prices.
In simple terms, what that means is government controls the prices of crude oil and basket of derived products under APM which provide a cushion to the consumers against the oil shocks in the global market.
How increase in international oil prices trickle down to consumer petroleum products?
The downstream players import more than 80% of the crude oil from the global markets. Any increase in crude oil prices globally would affect the petroleum prices. The downstream companies(OMC/refineries) deal with two kind of prices. One is crude oil price which refiners pay to purchase the crude oil (either from domestic or foreign producers). While 'refinery gate price' is the price at which the refiners “sell” the petroleum products to the next stage of the industry. So its easy to understand that as more than 80% of the crude oil requirements are met through imports, the prices of the petroleum end products are bound to get hit by international crude oil prices.
There are other important prices at various stages of the product journey to the end cosumer:
-> Pre-tax prices- This price can be arrived at by adding marketing, storage and transportation costs to the refinery gate price of the relevant petroleum product.
-> Retail prices - Adding excise duty (a form of tax levied by the Central Government) and sales tax (levied by State Governments) to the pre-tax price gives the final retail price of petroleum products, the price, for instance, that you or any of us pay at the petrol pump.
So, Retail price = crude oil price+ refinery gate price(refining cost+profit)+ pre-tax price(marketing and storage cost+profit)+ distribution cost+ dealers profit+ excise duty+sales tax
Why does Government provide cushion?
Refining of crude oil is a process industry where crude oil constitutes around 90% of the total cost. Since value added is relatively small, determination of individual product-wise prices becomes problematic. The oil marketing companies (OMCs) currently source their products from the refineries on import parity basis which then becomes their cost price which is the refinery gate price. The difference between the cost price and the realized price(i.e centrally determined sales price) called the 'under-recoveries' of the OMCs. This is the indicative measure of the subsidization of prices by GoI. In simple terms, OMCs are selling the products at prices much lower than their free market prices in a price control regime by government through subsidization.
Other sensitive products such as kerosene and domestic LPG are provided to the below poverty line consumer through Public Distribution System (PDS) on the ground that these were fuels of mass consumption largely consumed by “economically weaker sections of society”. The subsidy on these two products was to be continued on a flat rate basis financed from the budget and was to be phased out in three to five years.
When crude price increase is not passed through to consumers, the cost will have to be borne by oil marketing companies (OMCs). Since private OMCs would get out of a business if they made losses, it would be left to public sector OMCs to supply petroleum products at prices below their costs. If the OMCs are asked to bear the losses, they would go bankrupt. This would seriously compromise our energy security.
Under-recoveries of OMCs were at Rs 46,000 crore in 2009-10 !! But how does that contribute to the overall government budget deficit??
Tuesday, April 6, 2010
Virtualization using Smartphone Hypervisors
Gartner has released its 2009 hype cycle report for mobile device technologies. The hype cycle outlines 22 technologies at different stages of development and adoption cycle. A lot of hype has already been created around virtualization, cloud computing, Software-as-a-services etc. which now are well on their way for the mainstream adoption although with some hiccups.
The virtualization technology has also found a place for itself in the hype cycle for mobile device technologies. Gartner has included “Smart phone Hypervisors” as emerging technology in its first phase of a Hype Cycle called as "technology trigger" which is breakthrough of product launch or other event that generates significant press and interest.
Smartphone Hypervisors as a technology is a thin layer of virtualization software running on top of smartphone hardware which would essentially break dependencies between hardware and smartphone operating systems by virtually isolating the operating systems from the underlaying hardware architecture. So effectively, (OS+Apps) running on smartphone are not aware of the hardware on which they are running. As published in my earlier blogpost on mobile apps, there are virtually whole host of operating systems in the market, right from proprietary systems such as iphone, blackberry or Qualcomm or some are open system architecture based.

Looking at current available hardware and OS solutions for smartphones, it is not difficult to realize that these hardware and Operating systems have strong dependencies on each other. The benefit arising out of this arrangement is that we get a stable and high performing product. This very stringent but successful means is well being utilized as strong business strategy by companies like Apple for delivering great products to market. We may have alternatives such as symbian or Microsoft mobile OS which run of different hardware platforms and produce mixed results. However, vendors still have a tough time in making them work for these platforms. Hypervisor technology is the first step towards making standardization across different operating systems and hardware platforms for smartphones. If there is a hypervisor layer which can standardise and simplify what is presented to software then compatibility becomes less of an issue. Mobile OS software becomes a whole lot easier to write and new mobile phones can be released to market a lot quicker. The need for extensive test and development is cut dramatically for both the handset manufacturer and the mobile OS manufacturers. The usual strategic benefits would be:
· Break dependencies between OS and hardware there by introducing standardization in the industry.
· Manage OS and application as single unit by encapsulating them into VMs there by providing strong fault and security isolation. This may solve the security challenges which will be faced by mobile operators as more and more intelligent devices will get added.
· VMs are hardware-independent: they can be provisioned anywhere and faster thus improving time to market.
There are three main players in this market place at present Trango, VirtualLogix and OKLabs. Interestingly of the three, only OKLabs actually has it’s hypervisor product in handsets that have actually been released to market. At this point VMWare has acquired Trango, and Ctrix has made investments and partnerships with Open Kernel Labs. Right now the Trango hypervisor supports an interesting (but very limited) range of real-time OSes, including: Windows CE 5.0 and 6.0, Linux 2.6.x, Symbian 9.x, eCos, µITRON NORTi and µC/OS-II. Next questions would be: How will smatphone hypervisor market take off from this point? What will be strategies for players like VMWare going forward…Will the player exploit new opportunities created by cloud computing technologies? Will Cisco, Microsoft, Google or even Amazon make a similar play?
Will soon find out in the time to come..
Monday, March 22, 2010
Joining the App Store Bandwagon
Mobile applications are the add-on software for the wireless handheld devices such as smartphones and personal digital assistants (PDA). Among the most popular are games, social networking, maps, news, business, and weather and travel information. Mobile application vendors are now playing a crucial role in the global wireless market. As the networks are carrying more and more data minutes and telcos are building profitable business model around the value added services, it has become all the more important to assess the true potential of the mobile applications market.


According to wireless expert report, the global mobile application market including games is worth $ 4.66 billion in 2009 and will jump to $16.60 billion by 2013. The smart phone market is expected to surge 30% by 2013, approaching 1.6 billion users with sales expected to increase from 165.2 million in 2009 to 422.96 million in 2013.
If we look at the key players involved in the mobile applications market, we see a high degree of collaboration amongst Handset manufacturers, mobile network operators and suppliers of mobile operating systems over each other. Mobile Application Stores (MAS) are a new solution market which promises the development of a new revenue stream for operators, handset OEMs and application developers.
There are primarily three different kinds of mobile app stores:
Operator Portals, e.g. Airtel Live – these type of stores are owned and managed by the operator and have an inherent advantage of having the direct billing to consumer facility. Operators have been offering content and applications on their appstores for most of the last decade. The developers need to tieup with the operator and the operator takes over the responsibility of marketing, distribution and billing. However, in most of the cases, barring Japan Japan
3rd Party Store Fronts, e.g. GetJar – These appstores are owned and managed by third party. Users access these 3rd party application stores over the open internet which supports a large number of platforms and devices. The developer gets a high revenue share but marketing and visibility is a concern in this model. Unlike the operator portal or the device stores, the store does not have direct visibility to the users and hence the users have to search for these stores
Platform Application Stores, e.g. Ovi Store, Android Market – These appstores are primarily built by the device vendors and the operating system vendors. The biggest advantage is that the stores are embedded into the device and hence the discovery is simple. Moreover, they can target a large user base due to the volumes each device vendor does. This high volume potential is a big draw for the developers. Apple has also started the trend of sharing up to 70% of net revenues with the developers which means the developers are in demand like never before. The platforms can be proprietary (e.g. Apple) or open system (e.g. Symbian, Android). The trend in the recent times is towards a more open ecosystem.

Source: ITU
Recently Google Android has struck an alliance with Open Handset Alliance that has committed to launch the former’s device, so far only HTC has released such handsets--the G1 and Magic.If we look at the Indian scenario, all the major mobile operators have joined the bandwagon and have opened up their own appstores to woo their costumers and generate fresh revenue streams.

Thursday, February 11, 2010
Dangerous Knowledge
While googling, I came across two amazing mathematical documentaries “Fermat’s Last Theorem” and “Dangerous Knowledge”. Both have been filmed and narrated in a popular science style approach and show two completely different facets of a mathematician. The first one “Fermat’s Last Theorem” tells the story of a modern mathematician called Andrew Wiles, who achieved a great feat by proving Fermat’s last theorem in 1994. This unsolved problem had haunted the most brilliant minds of the world for centuries after Pierre de Fermat first conjectured it in his treatise in 1637. The documentary shows the commitment and single mindedness of the Andrew wiles for pursuing his ultimate quest of proving Fermat’s Last Theorem. This is a real story of a real mathematician who considers himself fortunate for getting an opportunity to pursue his dream and see his patience and hard work bear fruit in his lifetime.
The second documentary narrates the stories of four of the greatest mathematicians in history of mathematics Georg Cantor, Ludwig Boltzmann, Kurt Gödel and Alan Turing. The basic thought behind the documentary was to reveal the other side of the story i.e. when the quest of knowledge is so obsessive that one loses oneself in the whole pursuit which ultimately lead to their madness and tragic deaths. This is not new in the field of mathematics. The reason behind me saying that is because in mathematics, it is a very fortunate thing to see your work get recognized by your peers/contemporaries in your life time. The pursuit may be worth chasing and may revolutionize the understanding but it is very difficult to get the recognition if it shakes the vary foundations of the contemporary mathematics. That’s exactly what is narrated as part of second documentary where the quest for understanding infinity is what led these mathematicians to insanity.
The first documentary is a story of a dream, success and its recognition while the second one is story of quest, life in seclusion and eventually a tragic end.
Let me know your thoughts on the same……
Monday, January 25, 2010
3G Auction Design - An Economic Perspective
Economics is built on the basic premises of scarcity, abundance and rational human behavior. As the author of the book, undercover economist puts it, businesses or companies gain bargaining strength through scarcity which they want to exploit by creating pricing strategies and making customers pay more. Businesses would have some scarcity power in their wallet which could let them achieve some sort of monopolistic position within the kind of sector they are or the kind of products or services they are offering to the customers. We take telecommunication sector. We know that radio spectrum is a scarce resource and where there is scarcity there is money to be made. We will have a look at how the rights to use (telecom licenses) this scarce resource are put up for sale by the governments across the world and what are the most efficient methods adopted.
Oligopolistic Market
We see that telecom market is an oligopolistic market, which unlike more competitive markets in which firms are of much smaller size and one firm’s behavior has little or no effect on its competitors, an oligopolist that decides to lower its prices, change its output, expand into a new market, offer new services, or adverstise, will have powerful and consequential effects on the profitability of its competitors. For this reason, firms in oligopolistic markets are always considering the behavior of their competitors when making their own economic decisions.
To understand the behavior of non-collusive oligopolists (non-collusive meaning a few firms that do NOT cooperate on output and price), economists have employed a mathematical tool called Game Theory.
Two great game theorists, John Von Neumann and John Nash (subject of A beautiful mind) both were brilliant mathematicians. A game, according to the author, is an activity in which your prediction of what another person will do affects what you decide to do. Economists try and fit the game theory rules to the real life economics problems such as allocation of radio spectrum.
Spectrum allocations
Governments adopt two most popular methods for spectrum allocation which are beauty contests and auctions. In beauty contests, participants are awarded licences based on certain financial as well as qualitative parameters. The problem here is that the evaluation would be based on subjective criteria and the promise of future performance. Additionally, this is not a transparent process. Auction methods are superior to non-auction methods, as they help in the allocation of spectrum to those who value it the most, give maximum revenue to the government and ensure transparency. However, according to economist peter cramton, the goal for the government should be efficiency, not revenue maximization.
In spectrum auctions, the problems is, each bidder has its own forecasts , expansion plans, technology evolutions and its knowledge of the other bidders plans and insights is limited by the information communicated by other bidders through their bids. i.e .every body knows what is in their wallet but no body knows what is in others wallet.
Auctions could be open bid or sealed bid. In open bidding, the bidding process reveals information about valuations. This information promotes the efficient assignment of licenses, since bidders can condition their bids on more information. Bidders are able to bid more aggressively in an open auction, since they have better information about the item's value. The advantage of a sealed-bid design is that it is less susceptible to collusion. Open bidding allows bidders to signal through their bids and establish tacit agreements. With open bidding, these tacit agreements can be enforced, since a bidder can immediately punish another that has deviated from the collusive agreement. Signaling and punishments are not possible with a single sealed bid.
The US Auction
In the second half of 1990, FCC in US auctioned broadband PCS licenses for bands D, E and F to 153 bidders. Six of the 153 bidders in the DEF auction regularly signaled using code bids or retaliating bids. These bidders won 476 of the 1,479 licenses for sale in the auction, or about 40% of the available spectrum in terms of population covered. Controlling for market characteristics, these signaling bidders paid significantly less for their licenses. This problem occurred because the bids were published without rounding them to nearest few thousand dollars. This provided the bidders an opportunity to signal the other bidders which licenses they would prefer by making bids which contained area codes. This was the basic flaw in the design of the auction which did not take care of this aspect.
Though single-bid auctions are the best form to avoid collusion, the bidding process does not allow information exchange and efficient price discovery. In multi-stage auctions, each block of spectrum in a circle is allocated in separate auctions. This again restricts information availability and hampers price discovery. In a simultaneous ascending auction (SAA), all spectrum blocks are auctioned simultaneously in a single auction. The auction is conducted in multiple rounds. This ensures efficient price discovery. Additionally, the bidder is selected through transparent market mechanisms only. It also allows for superior aggregation when licenses of more than one circle are auctioned simultaneously. It has proved successful in the US and European countries. In India, “4th Telecom Operator” licences in various circles as well as FM Radio licenses were awarded through SAA.
The UK Auction
The UK auction was one of the most talked about auctions till date in the 3G auction history across the globe. The uniqueness of the auctions comes from the fact that the auction designers and Government regulator Ofcom had ensured that bidding needs to gather as many serious bidders as possible and ensure they turn up. By March 2000, thirteen registered bidders were all set and paid 50 million pounds deposits. The bidding process has been explained here. .
Now, around the time when these licenses were to be auctioned, four mobile-phone companies operated in Britain using “second-generation” (2G) technology. The incumbents were Cellnet, One-2- One, Orange, and Vodafone. (British Telecom(BT), the erstwhile state-owned monopolist privatized under Mrs. Thatcher, held a 60% stake in Cellnet which it increased to 100% in 1999.). Earlier, 2G licenses were awarded by UK government using the ‘beauty contests’.
The 3G auction was designed on Anglo-Dutch style. It had the best of both worlds i.e. an advantages of both sealed bid auction (which gives entrants a better chance of winning against strong incumbents such as mentioned above) and simultaneously ascending auction (SAA where the price starts low and competing bidders raise the price until no-one is prepared to bid any higher, at which point the final bidder then wins the prize at the final price he bids).
Earlier engineering considerations provided that only four liceses were available (called them B, C D and E bands). But later engineering advice changed and we were informed that it would be possible to make five licenses available instead of four. An additional band ‘A’ was introduced. Following was the distribution:
Licence A the largest = 2x15MHz of paired spectrum plus 5MHz of unpaired spectrum.
Licence B a little smaller = 2x15MHz of paired spectrum, but no unpaired spectrum.
Licences C, D and E are all roughly the same = each comprising 2x10MHz of paired plus 5MHz of unpaired spectrum.
The trick was to restrict the incumbents to licenses B, C, D and E and license A was reserved for a new entrant. This would ensure that one of the 2 large licenses (A or B) would go to the new entrant. The rules of the auction process were following:
• Auction design involved multiple rounds of simultaneous bids.
• In the first round, each bidder makes a bid on one license of its own choice. To remain in the auction, a bidder must be “active” in every subsequent round.
• An active bidder either currently holds he top bid on a particular licence, or else raises the bid on a licence of the bidder’s choice by at least the minimum bid increment.
• A bidder who is inactive in any round is eliminated from the rest of the auction. A bidder who currently holds the top bid on a license cannot raise or withdraw its bid, nor bid on another license in the current round.
• At the end of every round all bidders’ bids are revealed, the current top bidder for each license is determined, and minimum bid increments are set for the next round.
• The auction concludes when only five bidders remain. They are each then allocated the license on which
they are the current top bidder at the price they have currently bid for that license.
The initial expectations were that the auction might generate revenue of 2-3 billion pounds. But eventually surpassed all the expectations and generated a whopping 22.5 billion pounds and in the process had become the biggest auction ever in the history. Below table shows the 3G licenses issued in European nation, the awarding method and the money rose in the process.

Courtesy: emeraldinsight.com
Monday, January 18, 2010
Shift in the profitability zone
The rules of the telecom market are changing. Earlier the greater market share of the Telecom operator meant more customers which translates to greater profitability as there was only few operators and the incumbents like BSNL and MTNL had all the advantage. Also, as focus slowly shifted from wire line to wireless, incumbents could not adjust themselves quickly enough with the market. This gave the private players a leeway and a head start to launch their services in wireless space and slowly build the leadership position while catching up in the wire line space.
If we analyze telecom market, it’s an oligopoly. According to Charlie Munger, who was Warren Buffett's partner at Berkshire Hathaway, there are two kinds of Oligopoly. The constructive Oligopoly which allows all the companies to enjoy their respective share of the market without hurting each others margins. The destructive Oligopoly is the one which we can see now prevailing in the Indian Telecommunication market. In such a market the companies fight against each other for a larger market share but the ultimate winner is the consumer.
Not long ago, the only differentiating factor in this commodity kind of business was the call rates where it was difficult to retain subscribers and cost becomes the major deciding factor. The early mover advantage played a significant advantage but after the start of destructive oligopoly it is difficult to have sustained high return on Investment. Now, with more and more operators coming in (the number has now reached 11 per circle), the market has reached to a stage of hyper competition where players are getting into price wars and voice is rapidly getting commoditized.
We would analyze two key telecom KPIs: Minutes of Usage (MoU) and Average Revenue per minute (ARPM). MOU refers to minutes of usage or talk-time of subscribers. “Minutes of Usage” multiplied by Average Revenue per Minute (ARPM) to arrive at Average Revenue per User (ARPU).
So equations are simple:
No. of calls * call length = MoU
MoU * ARPM = ARPU
ARPU * Market share * Market = Total revenue
ARPM has shown a declining trend with respect to time but remained resilient through increase in MoU by launching creative campaigns and pricing strategies. But now, MoUs are no longer showing sensitivity to tariffs despite sharp cuts in tariffs and revenue per minute too is falling sharply.
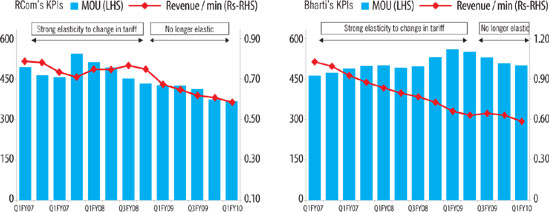
Source: IDFC SSKI; KPIs – Key performance indicators; MOU – minutes of usage

In an analyst’s language we call this a declining MoU elasticity. So we can see the trend:
ARPM Declining, MoU inelastic to price and stabilizing and hence ARPU declining.
In the past, price cuts typically resulted in more traffic on the networks as users increased talk time and hence increased MoU. So despite lower tariffs, telecom companies managed to protect profitability. But now, even that may become difficult as many telecom companies are struggling with spectrum-constrained networks. They may be close to exhausting their limits of taking on additional traffic. As recent TRAI reported that penetration in the urban areas already cross 100% mark, we see a clear trend of telcos to go rural going forward. Also, we can see other factors playing out such as bandwidth limitation in the urban areas leading to crowding up the spectrum by adding too many subscribers/Mhz which would create problems in QoS. So there is also a limit to that. However,China
In the past, price cuts typically resulted in more traffic on the networks as users increased talk time and hence increased MoU. So despite lower tariffs, telecom companies managed to protect profitability. But now, even that may become difficult as many telecom companies are struggling with spectrum-constrained networks. They may be close to exhausting their limits of taking on additional traffic. As recent TRAI reported that penetration in the urban areas already cross 100% mark, we see a clear trend of telcos to go rural going forward. Also, we can see other factors playing out such as bandwidth limitation in the urban areas leading to crowding up the spectrum by adding too many subscribers/Mhz which would create problems in QoS. So there is also a limit to that. However,
The only way to survive in this market is to identify the profit elements in this business and differentiate in the service offerings. Price is no longer a differentiator as all operators would match up with each other’s pricing strategies sooner or later. The real differentiators in this case would be:
- QoS (Quality of service)
- Greater emphasis on CRM and customer life-cycle management
- Greater focus on alternative revenue models
Friday, January 15, 2010
Mobile Number Portability - To be or not to be..
Will MNP see light of the day in Indian Telecom Scenario? The question still remains debatable as we see another round of dates change from government on implementation of MNP.
As per the original plan set out by DoT, MNP was to be implemented in two phases. Mobile users in metros and category A circles like Tamil Nadu and Maharashtra were slated to avail this provision from January 1, 2010, while the rest of the country would have had access to MNP from April 1, next year. But the government has now decided to implement it in whole of the country in one go, by April 31, 2010.
If we look into the history of MNP across the globe, lot of challenges have been faced by countries like UK, Germany, Hongkong because of inherent complications in its implementation. If we analyze, we see challenges from the cost perspective as:
- Cost involved in upgrading the network infrastructure to support number portability i.e. the set up cost
- Cost involved in maintaining the upgraded infrastructure
- Cost involved in the usage of network resources to route the calls to the ported number
The setup cost can include:
- Central Number portability Database (NPDB) setup cost
- Software development or upgrade ege. Software upgrade in MSC
- Network upgrade
- Customer Relationship Management (CRM) upgrade
- Cost involved in upgrading the billing system
The maintenance cost may include:
- Cost for the agreed procedure involved in the porting process
- Activating the ported number
- Provisioning the routing information
- Informing all the service providers of the ported number
Then we see technical issues that need to be considered are the requirements for Mobile to Mobile, Fixed to Fixed and/or Fixed to Mobile or Mobile to Fixed (intermodal) connectivity. And now VOIP applications like Skype coming into picture, the situation complicates further.
Subscribe to:
Comments (Atom)